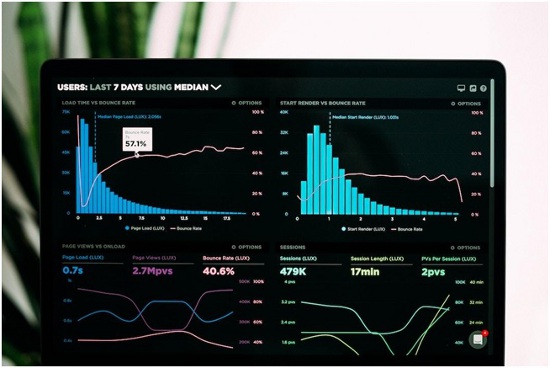
In a world dominated by data and metrics, businesses are eternally on the lookout for effective tools to analyze, interpret, and visually represent their data. One such valuable tool is a histogram. This simple yet powerful statistical tool can provide insightful understanding and clarity on voluminous data, making it an essential component in a business’s decision-making process. In this article, we will explore the benefits that histograms offer for business use.
An Overview of Histograms


A histogram is a type of bar graph that visualizes the distribution of continuous data. It converts raw data into something more digestible, enabling businesses to detect patterns and trends and analyze distribution over a specific period. Constructed by segregating data points into bins of equal size, it allows a smooth transition between data, providing a sense of the overall data spread.
In a histogram, the x-axis represents the data set, while the y-axis signifies the number of times those data points occur. The highest point in the histogram depicts the most frequently occurring value in the dataset.
The application of histograms is broad, covering areas from quality assurance in manufacturing to financial analysis in banking. For example, in manufacturing, it can be used to measure the deviation from the mean product size to assess product quality. While in marketing, it could help examine customer behavior trends over time. Essentially, histograms bring structure to raw data, making it easier for businesses to understand and interpret critical insights.
Visualizing and Interpreting Data


One of the main advantages of using histograms in business is that they offer businesses a means to represent complex big data visually. This can be extremely beneficial in terms of data interpretation and communication. It can turn a table full of numbers into a clear, easy-to-understand graph, demonstrating both the range and the frequency of a particular set of data.
The ability of histograms to represent large data sets visually allows business leaders, stakeholders, or even employees to quickly grasp the information without having to go through lines and lines of raw data. The visual representation can also help in identifying data patterns, such as outliers, which could potentially have significant impacts on business operations or decisions.
Furthermore, the visualization aspect of histograms allows businesses to present their data in a way that is easy for anyone to understand. This can be particularly important in meetings or presentations where complex data needs to be conveyed in an easily understandable way.
Identifying Trends and Patterns
Another distinct advantage of the histogram is its inherent ability to help businesses identify trends and patterns in their data. By nature, histograms are designed to display frequency distributions. The taller bars represent intervals with more observations, thus highlighting key data trends quickly.
For instance, a retailer could use a histogram to track the sales of different products over time. The histogram will visually display the data in a way that highlights the best and worst-selling products, enabling the business to identify and understand their sales trends. Identifying these trends can aid in inventory management and profit maximization and help develop effective marketing strategies.
Similarly, histograms can be used to identify patterns in customer behavior. For instance, an e-commerce business can use histograms to understand the peak times for website traffic or the most popular products among different demographic groups. Such insights could be invaluable in planning promotions or tailoring product offerings to meet customer demands.
Predictive Analysis and Forecasting
The use of histograms extends beyond analysis to being able to predict future trends based on past data. Businesses often use histograms to analyze historical data and identify patterns that can help them predict future performance.
For instance, a telecommunications company could use a histogram to analyze the usage patterns of its customers, including the most active times of day or days of the week. This analysis could then inform decision-making about when to schedule maintenance or make upgrades to avoid disrupting the majority of their customer base.
Sale forecasts are also an area where histograms can show their predictive prowess. By analyzing past sales data, companies can forecast future sales trends and make informed decisions about inventory, staffing, marketing, and more.
Altogether, the deployment of histograms offers a variety of benefits for businesses across different sectors. It enables clear visualization of data and identification of trends and enables predictive analysis. They serve as an invaluable tool in a business’s arsenal for data-driven decision-making, making them important in today’s data-rich business landscape.


