The Bitcoin Rainbow Charts are very popular in 2022 in the cryptosphere.
On Bitcoin Twitter, for example, and other online fora, the charts have been making the rounds in online postings since June.
That’s when the BTC price crossed over the critical threshold into the “Basically A Fire Sale” zone of the Bitcoin Rainbow Charts.
Ever since then, long-term BTC holders, bitcoin market bulls, and crazed Bitcoin maximalists have been posting it. But what is the BTC rainbow chart and is it accurate?
The Bitcoin Rainbow Chart: A Hodler’s Dream
The Bitcoin Rainbow Charts are an easy-to-understand, simple-to-use, yet powerful analyst recommendation tool.
Bitcoin and cryptocurrency investors should all add this to their investor analyst toolkit and keep this map of when markets are too hot and when they are oversold and ready for profitable entries.
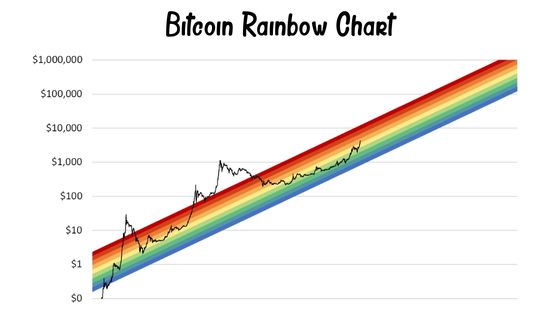
When the price of bitcoin moves into the upper range of the rainbow chart, into the yellow, orange, and red zones, the market is overheated.
That’s when the chart recommends selling some holdings to take profits, or reinvesting later into BTC at a lower price to increase your accumulation faster.
The market is oversold when the price of bitcoin moves into the lower range of the rainbow chart, into the blue, indigo, and violet zones.
That’s when the chart recommends buying and accumulating holdings to enter the market at an attractive price point, so that realized gains deliver higher ROI at any exit the entire way up to the next cyclical price peak.
Hodlers’ Motives and Doctrine
The Bitcoin Rainbow Charts are especially compatible with the views of log term BTC investors and useful to them in meeting opportunities to make profits or accumulate bitcoin faster.
Long-term bitcoin holders and accumulators have certain motivations and beliefs about bitcoin, technology, and global markets that inform their approach to keeping some of their savings in BTC.
These include global macro-finance, the existential threat of inflation to savings, and the importance, value, and near future of total global financial inclusivity.
Because of this, many of them (Twitter and Block founder Jack Dorsey, as well as Microstrategy CEO Michael Saylor, for example) believe that bitcoin will be the planetary reserve currency for international final settlement.
If such an extreme win scenario turns out to be Bitcoin’s ultimate future on our timeline, then it has a tremendous amount of upside left in it at today’s exchange rate prices.
Holders who believe Bitcoin could be so successful, or even go as far as staying as busy as Visa, have good reason to hold on to their bitcoin, and to accumulate.
They also have good reason to time entries strategically for the low point in bitcoin’s price cycles, so they can maximize profit.
Meanwhile, selling at cyclical highs is important for long-term holders because they expect and plan to go through multiple cycles of bitcoin price seeking as its network grows in market adoption.
They would leave an enormous amount of profit and ROI on the table if they did not make these adjustments at least every couple of years or every so many months.
Bitcoin’s Near Term Prospects
Bitcoin price has been on the ice since June, range bound around the key level of $20,000 for the coin on crypto exchanges.
That’s after spending last November through June on a steep price tumble from an outrageous Nov 2021 all-time high off $68,000 for a coin.
There appears to be a consistent level of confidence at the $20,000 level, but that doesn’t mean BTC couldn’t crater some more like it did in 2018.
On the other hand, bitcoin’s long-term holders aren’t selling, half of BTC is held at a gain, and institutions continue to adopt and implement services for Bitcoin.
Is The Bitcoin Rainbow Chart Reliable?
Yes, the Bitcoin Rainbow Chart is reliable. It is not investment advice and does not tell you what to do. The chart is, however, a reliable print of the historical price of BTC on a logarithmically scaled graph for the price dimension.
Overlaying the price of the precious cryptographically secured commodity is a rainbow color-coded band of Buy, Hold, and Sell recommendations.
These are reliable as a back-tested historical strategy.
The band is calibrated so that most of the time from 2012 through 2022 if you had followed the Bitcoin Rainbow Charts’ recommendations, it would have resulted in positive trades.
Of course, past performance is not a guarantee of future results.