What’s the first thing that you need when you want to gain a profit in Forex trading? It’s not to get large investments or offers, rather the most important thing you need is a good market evaluation. You can’t anticipate making a profit if you have zero idea about the Forex market. Being a new trader, having knowledge of exchange rates is not enough. You must have strong skills in technical analysis too. A successful trader is always aware of the current market value of currencies as well as the potential support and resistance level. Forex trading is never constant and the price of the trading instrument is always prone to sudden fluctuation. So, there are potential risks of losing if you fail to speculate about exchange rates beforehand.
Again, imagine that you need to do some research on the market value of a product but you barely have time to do so. You cannot possibly sit with the datasheets just to learn about the opening and closing value of a currency pairs over the past week. So, what do you do? Do you give up? Or find an alternative which is less time-consuming and more understandable?
Well, since we don’t have the phrase ‘give up’ in our dictionary, we’ll look for a different approach to help us in this situation.
This, the necessity of a candlestick chart and its role in your trading comes into play.
A candlestick chart:
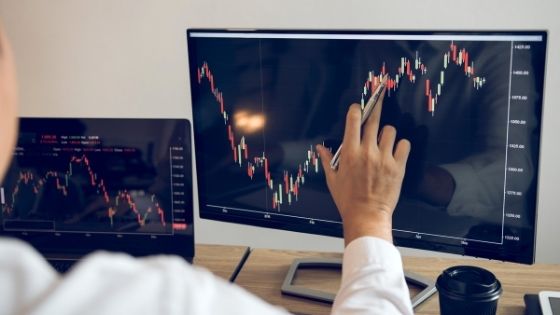
Among the several types of charts, the candlestick chart is one of the most popular price charts where information is presented in the form of candles. It usually shows the data encrypted in a particular period like a day, four hours, or even 2 weeks. However, it typically shows the data of one trade.
Since the candlestick chart always follows a similar pattern, viewers can easily understand and read the chart. Truth be told, it’s actually child’s play!
The candlestick chart is also known as the Japanese candlestick chart named after its place of origin. Researchers say that this chart first came into use in the 18th century during the Meiji period in Japan.
There are generally four types of candle. These are:
- Bullish Candle
- Bearish Candle
- High
- Low
Definitions
Bullish Candles and Bearish Candles
1. Bullish Candle
The bullish candle got its name from “bull” or “bullish” which represents the belief that an action will rise upwards aggressively. In order to trade ETFs, you must have a clear idea about the bullish candle. In simple terms, a bullish candle is a pattern that is used to picture the rise in the value of a commodity or any financial instrument from its opening price to the closing price in a particular period. To put it simply, if the closing price goes up above than the opening price, then a bullish candle is used to picture that.
2. Bearish Candle
Like a bear, a bearish candle tends to go down, pushing the prices downward with it.
A bearish candle is used when the closing price of any currency pair is lower than the opening price. In other words, it shows a decline in price from opening to closing.
High and Low
Even though bullish and bearish candles are used to show the comparison between opening and closing prices at the end of a particular time, they cannot indicate the changes that occurred within the time. So, how do we know about them?
To solve this problem, candlestick charts have high and low lines with each candle.
1.High
High lines are drawn on the upper side of a candle. High lines show how much the price has increased since the opening.
The higher the high line is, the more beneficial it is to sell a commodity to make a profit. On the other hand, if you are planning on buying, then buying at a high line will cause you to lose.
2. Low
Just like high lines, low lines are drawn but in the opposite direction. Low lines are shown under the closing price of a candle.
Low lines show how much the price declined within a certain period since the opening. Buying at low lines is highly profitable
Analyzing the candles
The most distinct feature of the candlestick chart is that the candles are of different colors based on their types. For as instance, bullish candles can be of green color while the bearish candles can be of red colors. As a result, just by looking at the chart, one can understand whether the price is rising or declining. It also highlights the previous price changes.
So, to win some money in Forex trading, you should look at the candlestick charts!